


Attribute MSA with SigmaXL
Use SigmaXL to Implement an Attribute MSA
Data File: “Attribute MSA” tab in “Sample Data.xlsx” (an example in the AIAG MSA Reference Manual, 3rd Edition).
Step 1: Reorganize the original data into four new columns (i.e., Appraiser, Assessed Result, Part, and Reference).
- Select the entire range of the original data (“Part”, “Reference”, “Appraiser A”, “Appraiser B” and “Appraiser C” columns)
- Click SigmaXL -> Data Manipulation -> Stack Subgroups Across Rows
- A new window named “Stack Subgroups” pops with the selected data range appearing in the box under “Please select your data”

- Click “Next>>”
- A new window named “Stack Subgroups Across Rows” appears
- Select “Appraiser A”, “Appraiser B” and “Appraiser C” as “Numeric Data Variables”
Select “Part” and “Reference” as the “Additional Category Columns”
Enter “Assessed Result” as the “Stacked Data (Y) Column Heading (Optional)
Enter “Appraiser” as the “Category (X) Column Heading (Optional)”

- Click “OK>>”
- The stacked data are created in a new worksheet.
Step 2: Run a MSA using SigmaXL
- Select the entire range of the data (“Part”, “Reference”, “Appraiser” and “Assessment Result” columns)
- Click SigmaXL -> Measurement Systems Analysis -> Attribute MSA (Binary)
- A new window named “Attribute MSA (Binary)” pops with the selected data range appearing in the box under “Please select your data”
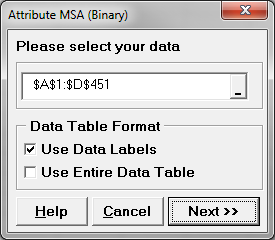
- Click “Next>>”
- A new window named “Attribute MSA (Binary)” appears
- Select “Part” as “Part/Sample”
Select “Appraiser” as “Appraiser”
Select “Assessed Result” as “Assessed Result”
Select “Reference” as “True Standard (Optional)”
Select “1” as “Good Level”
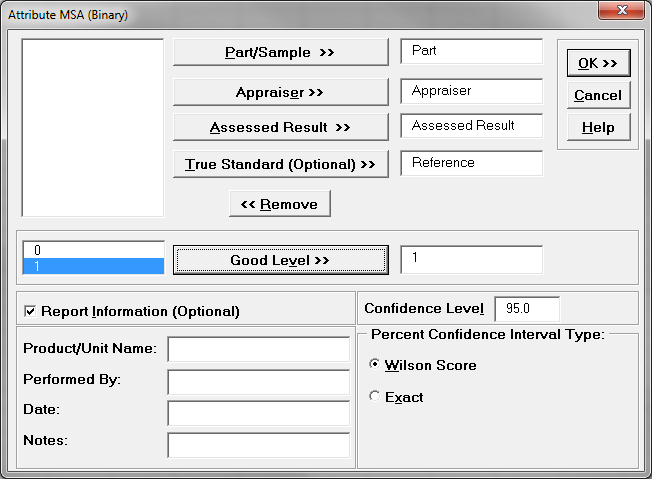
- Click “OK”
The MSA results appear in the newly generated tab “Att_MSA_Binary”.
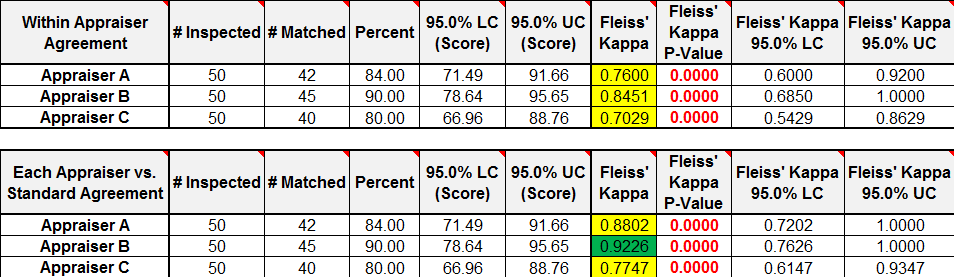 The rater scores represent how the raters agree with themselves. Appraiser A, for instance, agreed with himself on 84% of the measurements made.
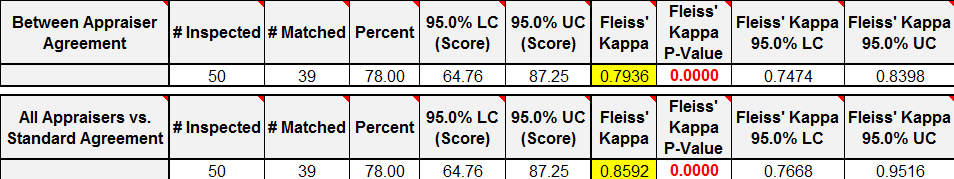 The important numbers are called out here. Of the 50 total measurements performed, for 78% of those (39) the appraisers agreed with both themselves and the other appraisers.
Kappa statistic is a coefficient indicating the agreement percentage above the expected agreement by chance. Kappa ranges from −1 (perfect disagreement) to 1 (perfect agreement). When the observed agreement is less than the chance agreement, Kappa is negative. When the observed agreement is greater than the chance agreement, Kappa is positive. Rule of thumb: If Kappa is greater than 0.7, the measurement system is acceptable. If Kappa is greater than 0.9, the measurement system is excellent.
 Model summary: In all cases the Kappa indicates that the measurement system is acceptable.