


Chi Square Tests with SigmaXL
Chi Square (Contingency Tables)
We have looked at hypothesis tests to analyze the proportion of one population vs. a specified value, and the proportions of two populations, but what do we do if we want to analyze more than two populations? A chi-square test is a hypothesis test in which the sampling distribution of the test statistic follows a chi-square distribution when the null hypothesis is true. There are multiple chi-square tests available and in this module we will cover the Pearson’s chi square test used in contingency analysis.
[unordered_list style=”star”]
- Null Hypothesis (H0): p1 = p2 =… = pk
- Alternative Hypothesis (Ha): At least on of the proportions is different from others
[/unordered_list]
The symbol k is the number of populations of our interest; k ≥ 2.
What is the Chi Square Test?
The chi-square test can also be used to test whether two factors are independent of each other. In other words, it can be used to test whether there is any statistically significant relationship between two discrete factors.
[unordered_list style=”star”]
- Null Hypothesis (H0): Factor 1 is independent of factor 2.
- Alternative Hypothesis (Ha): Factor 1 is not independent of factor 2.
[/unordered_list]
Chi Square Test Assumptions
[unordered_list style=”star”]
- The sample data drawn from the populations of interest are unbiased and representative.
- There are only two possible outcomes in each trial for an individual population: success/failure, yes/no, and defective/non-defective etc.
- The underlying distribution of each population is binomial distribution.
- When np ≥ 5 and np(1 – p) ≥ 5, the binomial distribution can be approximated by the normal distribution.
[/unordered_list]
How Chi Square Test Works
Test Statistic
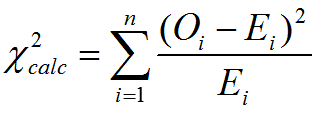
Where:
[unordered_list style=”star”]
- Oi is an observed frequency
- Ei is an expected frequency
- N is the number of cells in the contingency table
[/unordered_list]
If ![]() (calculated chi-square statistic) is smaller than
(calculated chi-square statistic) is smaller than ![]() (critical value), we fail to reject the null hypothesis. The test statistic is calculated with the observed and expected frequency.
(critical value), we fail to reject the null hypothesis. The test statistic is calculated with the observed and expected frequency.
Use SigmaXL to Run a Chi Square Test
Case study 1: We are interested in comparing the product quality exam pass rates of three suppliers A, B, and C using a nonparametric (i.e. distribution-free) hypothesis test: chi-square test.
Data File: “Chi-Square Test1” tab in “Sample Data.xlsx”
[unordered_list style=”star”]
- Null Hypothesis (H0)): pA = pB = pC
- Alternative Hypothesis (Ha): At least one of the suppliers has different pass rates from the others
[/unordered_list]
Steps to run a chi-square test in SigmaXL:
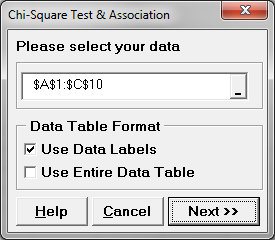
- Select the entire range of data (Supplier, Results, & Count)
- Click SigmaXL -> Statistical Tools -> Chi-Square Tests -> Chi-Square Test & Association
- A new window named “Chi-Square Test & Association” pops up with the selected range appearing in the box under “Please select your data”
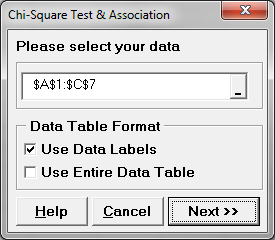
- Click “Next>>”
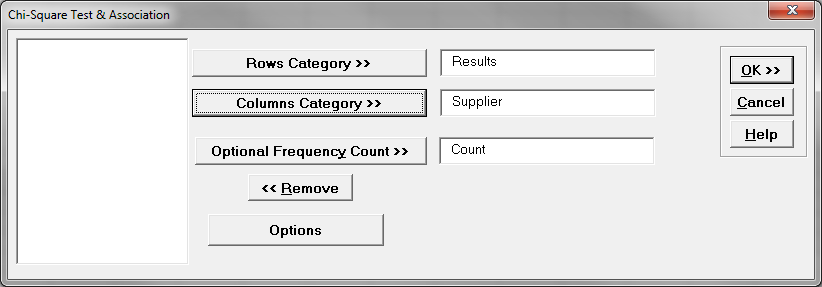
- A new window named “Chi-Square Test & Association” pops up.
- Select “Results” as “Rows Category”
Select “Supplier” as “Columns Category”
Select “Count” as “Optional Frequency Count”
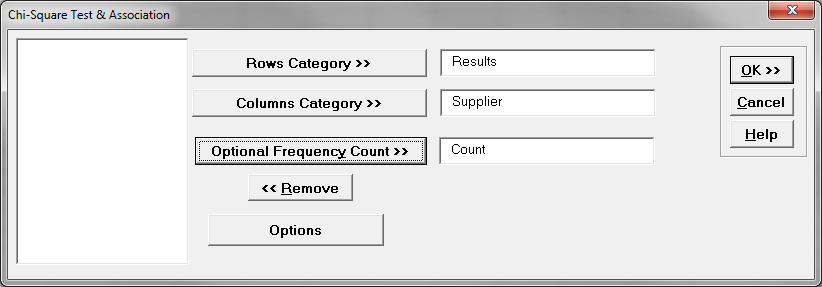
- Click “OK>>”
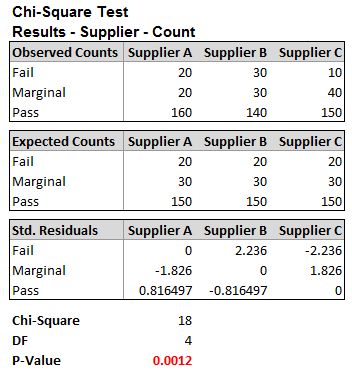
- The Chi-square test results appears automatically in the new tab “Chi-Square (1)”
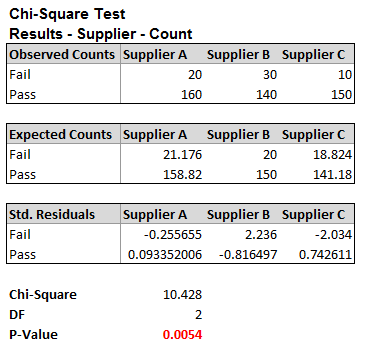
Model summary: Counts are based on the sample observation. Expected counts are based on the assumption that the null hypothesis is true. Since the p-value is smaller than alpha level (0.05), we reject the null hypothesis and claim that at least one supplier has different pass rate from others.
Case study 2: We are trying to check whether there is a relationship between the suppliers and the results of the product quality exam using nonparametric (i.e. distribution-free) hypothesis test: chi-square test.
Data File: “Chi-Square Test 2” tab in “Sample Data.xlsx”
[unordered_list style=”star”]
- Null Hypothesis (H0): Product quality exam results are independent of the suppliers.
- Alternative Hypothesis (Ha): Product quality exam results depend on the suppliers.
[/unordered_list]
Steps to run a chi-square test in SigmaXL:
- Select the entire range of data (Supplier, Results, & Count)
- Click SigmaXL -> Statistical Tools -> Chi-Square Tests -> Chi-Square Test & Association
- A new window named “Chi-Square Test & Association” pops up with the selected range appearing in the box under “Please select your data”
- Click “Next>>”
- A new window named “Chi-Square Test & Association” pops up.
- Select “Results” as “Rows Category”
Select “Supplier” as “Columns Category”
Select “Count” as “Optional Frequency Count”
- Click “OK>>”
- The Chi-square test results appears automatically in the new tab “Chi-Square (1)”
Model summary: The p-value is smaller than the alpha level (0.05) and we reject the null hypothesis. The product quality exam results are not independent of the suppliers. These results indicate the danger that we can get into when using discrete data. Not everything is as simple as yes/no or pass/fail. Even though supplier C has a lower fail rate of 10, you can see that the number of marginal results is higher. However, the p-value tells us that we must reject the null hypothesis and claim that the quality exam results are dependent on the suppliers.