


Median Test with SigmaXL
What is Mood’s Median Test?
Mood’s median test is a statistical test to compare the medians of two or more populations.
[unordered_list style=”star”]
- Null Hypothesis (H0): η1 = … = ηk
- Alternative Hypothesis (Ha): At least one of the medians is different from the others
[/unordered_list]
The symbol k is the number of groups of our interest and is equal to or greater than two. Mood’s median is an alternative to Kruskal–Wallis. For the data with outliers, Mood’s median test is more robust than the Kruskal–Wallis test. It is the extension of one sample sign test. In a one-sample sign test, the null hypothesis is that the probability of a random value from the population being above the specified value is equal to the probability of a random value being below the specified value.
Mood’s Median Test Assumptions
[unordered_list style=”star”]
- The sample data drawn from the populations of interest are unbiased and representative.
- The data of k populations are continuous or ordinal when the spacing between adjacent values is not constant.
- The k populations are independent to each other.
- The distributions of k populations have the same shape.
- Mood’s median test is robust for non-normally distributed populations.
- Mood’s median test is robust for data with outliers.
[/unordered_list]
How Mood’s Median Test Works
Step 1: Group the k samples from k populations (sample i is from population i) into one single data set and get the median of this combined data set.
Step 2: Separate the data in each sample into two groups. One consists of all the observations with values higher than the grand median and the other consists of all the observations with values lower than the grand median.
Step 3: Run a Pearson’s chi-square test to determine whether to reject the null hypothesis.
[unordered_list style=”star”]
- Null Hypothesis (H0): η1 = … = ηk
- Alternative Hypothesis (Ha): At least one of the medians is different from the others.
- If
 is greater than
  , we reject the null hypothesis and claim that at least one median is different from the others.
 - If is smaller than , we fail to reject the null hypothesis and claim that the medians of k populations are not statistically different.
[/unordered_list]
Use SigmaXL to Run a Mood’s Median Test
Case study: We are interested in comparing customer satisfaction among three types of customers using a nonparametric (i.e.distribution-free) hypothesis test: Mood’s median test.
Data File: “Median Test” tab in “Sample Data.xlsx”
[unordered_list style=”star”]
- Null Hypothesis (H0): η1 = η2 = η3
- Alternative Hypothesis (Ha): At least one customer type has different overall satisfaction from the others
[/unordered_list]
Steps to run a Mood’s median test in SigmaXL
- Select the entire range of data (both “Customer Type” and “Overall Satisfaction”
- Click SigmaXL -> Statistical Tools -> Nonparametric Tests -> Mood’s Median Test
- A new window named “Mood’s Median” pops up with the selected range appearing in the box under “Please select your data”
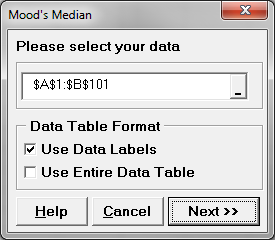
- Click “Next>>”
- A new window named “Mood’s Median Test” appears
- Select “Overall Satisfaction” as the “Numeric Data Variables (Y)”
Select “Customer Type” as the “Group Category (X)”
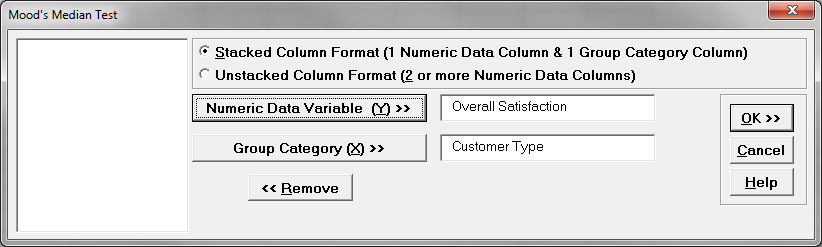
- Click “OK”
- The Mood’s median test results appear in the newly generated tab “Mood’s Median (1)”
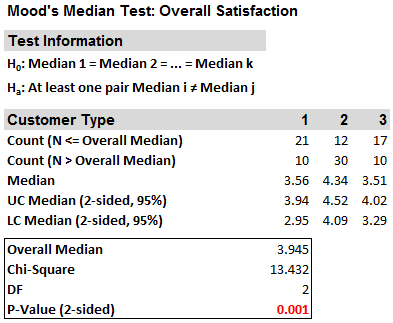
Model summary: The p-value of the test is lower than alpha level (0.05), and we reject the null hypothesis and conclude that at least the overall satisfaction median of one customer type is statistically different from the others. Since the p-value is less than 0.05, we reject the null hypothesis and claim that at least one customer group has a different level of satisfaction than the others.